![]()
Dimensional
Overview
Functional Descriptions
HSI-24
HSU-128
System Specifications
HSI-24
HSU-128
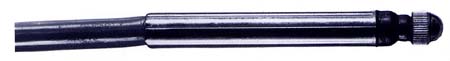
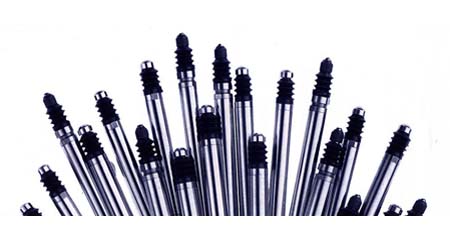
Probes
Probes List
Features
4001
0.8mm/32mil
4002
1.5mm/60mil
4004
3.0mm/120mil
4010-0 0.5mm/20mil
4010-1 0.5mm/20mil
4010-2 0.5mm/20mil
4012
2.0mm/80mil
Spare Parts
Probes for IQS Wheel System
Signal Conditioner for
IQS Wheel System
Strain/Pressure
HSS-10
System Specifications
HSS-10
Customizing
Software
Applications
Probe Attachments
Cable Modifications
Software/
Documentation
Downloads
HSI-24
Manuals
HSI-24 Drivers & Libraries
HSI-24 App Program
HSU-128 Manuals
HSU-128 Drivers & Libraries
HSU-128 App Program
HSS-10 Software
Software/
Documentation
Downloads
HSP-8 Drivers & Libraries
HSP-8 App Program
Miscellaneous
About the
Company
Table of contents
We are dedicated to the satisfaction of our customers
providing Probe Products signal conditioners, Nairda probes
and solutions to all their measurement needs.
![]()
HSI-24 SOFTWARE
| GENERAL DESCRIPTION | |
| STARTUP/SETUP OPTIONS | |
| MENU 1 | |
| MENU 2 | |
| CHANNEL SCROLLING KEYS | |
| BAR GRAPHS |
GENERAL DESCRIPTION OF HSIDEMO PROGRAM
The program HSIDEMO.EXE will construct up to 96 'channels' of input-derived data, using from one to four HSI-24 systems. The channels may be viewed eight at a time in tabular form, or up to forty total across the screen of a VGA monitor in bar graph form. In tabular form the left and right arrow keys shift the channel display window.
A channel is defined using a formula which may be any combination of transducers, analog inputs, functions, arithmetic operators or other channels. The functions provided include MAX HOLD, MIN HOLD, TIR, SINE, COSINE, ARCTANGENT, etc. A channel may be offset by any amount to produce readings that correspond to actual part dimensions in any convenient engineering units, or deviation from zero.
The MAX, MIN, and TIR functions are periodically recomputed. The scanning time for this computation is programmable. The scanning may also be stopped to allow the readings to be frozen.
Both transducer and analog inputs may be assigned an offset and full scale value. The offset is used as a zeroing aid. The full scale value sets the output of the transducers and analogs to the desired engineering units.
Normally a channel value is computed when the HSI-24 receives a request for that channel. Certain functions (MAX, MIN and TIR) are periodically computed.
The file HSICOMM.C includes functions which are callable from such application software and should be used as a foundation for communication with the HSI-24.
*PLEASE NOTE: Although the term "LVDT" is used within commands in this document, many other transducers may be used with the HSI-24. Should half-bridge and LVDT transducers be mixed within a system, the sensitivity of all units may be matched for compatibility. Also, many strain gauges, and most potentiometric transducers can be operated with AC excitation, so those types may also be used. Contact PROBE PRODUCTS CORPORATION for suggestions on specific applications.
HSIDEMO has the following command line options:
| /a sets an alternate I/O address for the HSI-24 | |
| /f sets the filename for both timed and F1 key file storage. | |
| /s loads the setup file named immediately after the option. |
CAL40B.CFG Setup File
The CAL40B.CFG setup file performs the following:
| Defines 40 channels with transducer inputs 1 to 24 | |
| Sets FSV on all 24 transducers to .040 | |
| Sets bar graph scales on all 24 bars to .040 | |
| Sets over limit on all 24 bars to .030 | |
| Sets high approach on all 24 bars to .020 | |
| Sets low approach on all 24 bars to -.020 | |
| Sets under limit on all 24 bars to -.030 | |
| Sets scan time to "1000". (100 milliseconds) | |
| Enables scanning for MAX, MIN and TIR functions |
HSIDEMO Default Setup
If no setup file is loaded the defaults are:
| No channel definitions | |
| Zero offset on all 96 channels is 0 | |
| FSV on all 96 transducers is .020 | |
| Zero offset on all 96 transducers is 0 | |
| FSV on all 16 analog inputs is 1.00 | |
| Zero offset all 16 analog inputs is 0 | |
| Scale on all bars is .020 | |
| Over limit on all bars is .018 | |
| High approach on all bars is .015 | |
| Low approach on all bars is -.015 | |
| Under limit on all bars is -.018 | |
| Scan time is 100 (10 milliseconds) | |
| Scanning enabled |
The following keys are active in Menu 1:
| escape Switch to menu 2. | |
| Q Stops the program and returns to DOS | |
| R Resets max, min and run-out readings | |
| C Save/Load of subsystem configuration | |
| F Define channel formula | |
| T Set scanning time | |
| E Clear all channel formulae | |
| S Turn scanning on/off | |
| D Enables display of diagnostic data to/from the HSI-24 | |
| Z Sets bar graph scale | |
| <>B Displays bar graphs | |
| L Sets bar graph limits | |
| I Sets number of decimal places | |
| P Printing/File setup for timed measurements |
The following keys are active in Menu 2:
| escape Switch to menu 1. | |
| 1 Set zero offset for a transducer.* | |
| 2 Auto zero one or all transducers. | |
| 3 Remove zero offsets for one or all transducers. | |
| 4 Set transducer full scale value. | |
| 5 Set zero offset for an analog input.* | |
| 6 Auto zero on or all analog inputs. | |
| 7 Remove zero offsets for one or all analog inputs. | |
| 8 Set full scale value for an analog input. | |
| 9 Set number of readings to average. | |
| <>0 Set length of running average filter. | |
| M Set multiplexor settling time. (Used for production test only) | |
| A Set zero offset for a channel*. | |
| B Auto zero one or all channels. | |
| C Remove zero offsets for one or all channels. | |
| R Resets max, min and runout readings |
*NOTE: These functions can be used to display actual sizes rather than deviation-from-zero.
HSIDEMO Channel Scrolling Keys
The following keys are active in both Menu 1 and Menu 2:
| down-arrow Displays next lower channel. | |
| left-arrow Displays next lower channel. | |
| up-arrow Displays next higher channel. | |
| right-arrow Displays next higher channel. | |
| page-down Displays next lower 8 channels. | |
| page-up Displays next higher 8 channels. | |
| home Displays channels 1 to 8. | |
| end Displays channels 89 to 96. | |
| F1 Stores/prints channel values | |
| escape Toggles between menu 1 and menu 2 |
- The bar graphs display the current values of up to 40 channels. A
- color monitor will display green, yellow and red bars depending on how
- the displayed value relates to the limit points, while a monochrome monitor will display monochrome bars. Each bar has an independent scaling factor, over limit, high approach limit, low approach limit and under limit.
The bars are displayed from menu 1 with the B command. To return to menu 1 use the escape key. While the bars are displayed the F1 key (store data to file), R key (reset MAX/MIN/TIR) and S key (start/stop scanning) may be used. The F1 key will not display a warning message if no data output file was defined and F1 is used while the bars are displayed. No harm is done in this case, except the data will not be stored.
- The scaling factor for the bars is set via the menu 1 Z command.
- The scaling factor for each bar graph may be set independently of
- the other bar graphs. The scaling factor would normally be set to
- the FSV of the formula which defines the channel for the bar.
- Example 1: If Channel 1 = T1 and the FSV of T1 is .04 inches, set
- the scale for bar 1 to .04.
- Example 2: If Channel 1 = T1+T2 the FSV of T1 is .04 inches and the
- FSV of T2 is .04 inches, set the scale for bar 1 to .08.
- Other scaling factors may be used as desired for applications not
- requiring full transducer stroke.
- The limit values for the bars are set via the menu 1 L command.
- The limits for each bar graph may be set independently of the other
- bar graphs. There are four limits associated with each bar graph;
- over limit, high approach, low approach and under limit. The over
- limit and high approach must be zero or greater. The under limit and
- low approach must be zero or less (negative values). In addition the
- limit values must satisfy "over limit = high approach = low approach
- = under limit". If the limit values do not satisfy this relationship
- the B command will display an error message, so if this occurs
- check all limits to be sure they all satisfy the above relationship.
- When using the L command the present value of the limit is displayed
- in parentheses. If you do not wish to change the displayed value hit
- the Enter key without typing a new value.
- If, on a color monitor, you want the bars to display only green and
- red (no approach limits in yellow), set the over limit and the high
- approach limit to the same value. This causes the approach region
- to be skipped. The same idea can be used for the under and low approach
- limits.
The bar graph display will only display as many bars as there are channels defined. It will never display more than 40 bars due to screen width limitations. The bar graph display will stop at the first channel which has no formula.